Cayaba Care Patient App: Care Plan
A web-based healthcare product for low-income pregnancy moms.
My role
User Research, User Experience Design, User Interface Design, User Testing
Team
Holistic Product Designer: Junru, Product Manager, 3 Developers
Tools
Figma, Adobe Illustrator, Adobe Photoshop, Miro, Excel
Duration
8 months
Background Overview
Patient App - Care Plan
-
From the product manager, I get my mission is to look into the service process and design a brand new product patient app to improve the existing patient experience with the service.
-
To display more deeply and provide more details of the design process, I will display one of the main features of the patient app: the care plan.

Appointment
Care Plan
Dashboard
Moms have some complaints...
"I do not know the care plan services in the future and do not know what to do to prepare for future service."

" Now, I can only see the pamphlets to check what I can get in each visit, I could not track my care plan journey service".
Initial Patient Feedback
As a sole product designer, to find out the main pain points. I first collect information as much information as I can from product manager introduction and feedback from care team members, I find out one of the most mentioned complaints from moms is about care plan journey services.
Initial Design Goal
My goal is to create design solutions to help moms
Make the service more convenient and efficient
Make the care plan journey more trackable
Make the care plan journey more trackable.
Provide comprehensive access for users to manage their care.
USER RESEARCH
Journey map
What is the current patient service experience like?
To get more context and understand current patients mom experience when they engage with cayaba care services and find out the pain points and opportunities through the experience, I conduct desktop research, interview with inner care team members, and use a journey map to dispplay users' every touchpoint and highlight users' experience pro, cons, and opportunities throught the service process.

Quantitive research: Survey
Gathering users feedback and data points
To get comprehensive user feedback and understand their satisfaction and dissatisfaction through the survey, I prepare the survey scripts and conduct the user survey with the product manager through the zoom. After that, I synthesize the survey result and get the data points of the following.

What are my insights from survey
-
Users are satisfied with service content and they like care team members.
-
Provide sufficient guidance information on each appointment service for users to understand and prepare visits.
-
"What to expect" and " Baby center" are two successful competitive that need more study and analysis.
Learning:
-
Use the timeline to organize all benefits and services for users to easily track.
-
Create vivid illustrations to represent each visit and benefit to bring a visually delightful experience.

Learning from successful competitves
Heuristic Competitive Analysis
Since I get important feedback that two competitive applications leave a good impression and user experience to our target users, so I download these two applications and simulate the task as a pregnant mom, and I find some common design strategies and summary my learnings.
Synthesis : Problem Statements and proposed solutions
Narrow down key pain points and key proposed solutions.
After all research methodologies, I find out many pain points as well as getting many insights. There are some common pain points mentioned many times and emphasized by the users, which are more eager for me to solve these problems. So I decide to narrow down the pain points to the three most valuable key topics and provide the corresponding key design ideas I propose.

DESIGN PROCESS
Information architecture
Start with the organizing and structuring content.
Before I begin to design wireframes, I use the information architecture to clearly layout, organize, and structure the information with the product, which helps me to understand the flow and what information users need to know through the experience.

Exploration
Design brainstorm to explore different solutions
Based on the information architecture, I explore many different concept design solutions and display these design solutions to the inner team including the product manager, engineer teams, and care team members to get feedback. After voting, I narrow it down to 3 design assumptions that are the most user-friendly and feasible for our engineers team.

Validation
A/B testing: Validate 3 main assumptions
To validate which design solution most fits users' needs, I conduct A/B testing (20 minutes) for 16 users, create a prep doc and script, display three design prototypes throughout the zoom, to test which assumption most allow users to clearly understand the care plan content, and observe user behaviors and in-depth feedback.

My findings from A/B testing:
-
14 of 16 users choose Version 3. Version 3 successfully explain the Cayaba care program plan in the whole pregnancy journey, users know specific detail of each visit service by trimesters and have trust that they can get support and long term care from Cayaba Care
-
15 Patients like vertical scrolling to check all services at one time
Users feedback: What needs to be improved?
-
“When all the services come together, I feel confused and could not figure out what is required visits they should attend and what is optional extra benefits. It is just not perfect categorized” Version one is good in this part
-
“I want to see where are my personalized services and benefits. I want to track all my care and the process.”
Iteration
Iterating Site map
After the concept testing, I gathered the research insights and applied those to my design. The first step is to update the information structure to divide the care plan into care plan journey, extra benefits, and collaborative plan, which is more clear for users to understand all information and their difference in the care plan.

Iteration
Iterating Concept Design
Based on the updated information architecture, I make the iterations of the prototype design. To make sure the optimized solution more fit users' need. I conduct a quick a/b testing, and all users prefer the updated design solution.

Second round Exploration and Validation
Design Explorations and Concept testings
After making the initial concept design solution, to find out better experience, I begin to explore the mi-fi design prototypes and provide three design solutions for each category of care plan: care plan journey, extra benefits, and collaborative plan. To validate the best solution, I conduct 3 concept testings and get users' feedback as well as gather my learning and insights.

User testing learning
-
For care plan journey version 3, users are attracted by vivid illustrations of each appointment
-
For the Extra benefits version1, users would love to see more illustrations compared to all texts content.
-
For collaborative plan version 2, users can clearly know from a different perspective of care services, what they need to do, and track all the processes.
Users feedback: What needs to be improved?
-
In Care Plan Journey, users complain that it is too noisy to see so many texts in each visit and this text is also too short to explain what is information about each visit.
Iteration
Iterating design
After the A/B tests, I gathered the research insights and applied those to my design. I also make the visual design align with our design guidelines and made sure all the design was ready to hand off to the engineers.


User Interface Design
I also design the hi-fidelity prototype and make sure the visual design align with our design guidelines and made sure all the design was ready to hand off to the engineers.

MAIN FEATURE

Problem 1:
-
Patients feel complicated to see different brochures all around to check different care plan services in different places.
Solution:
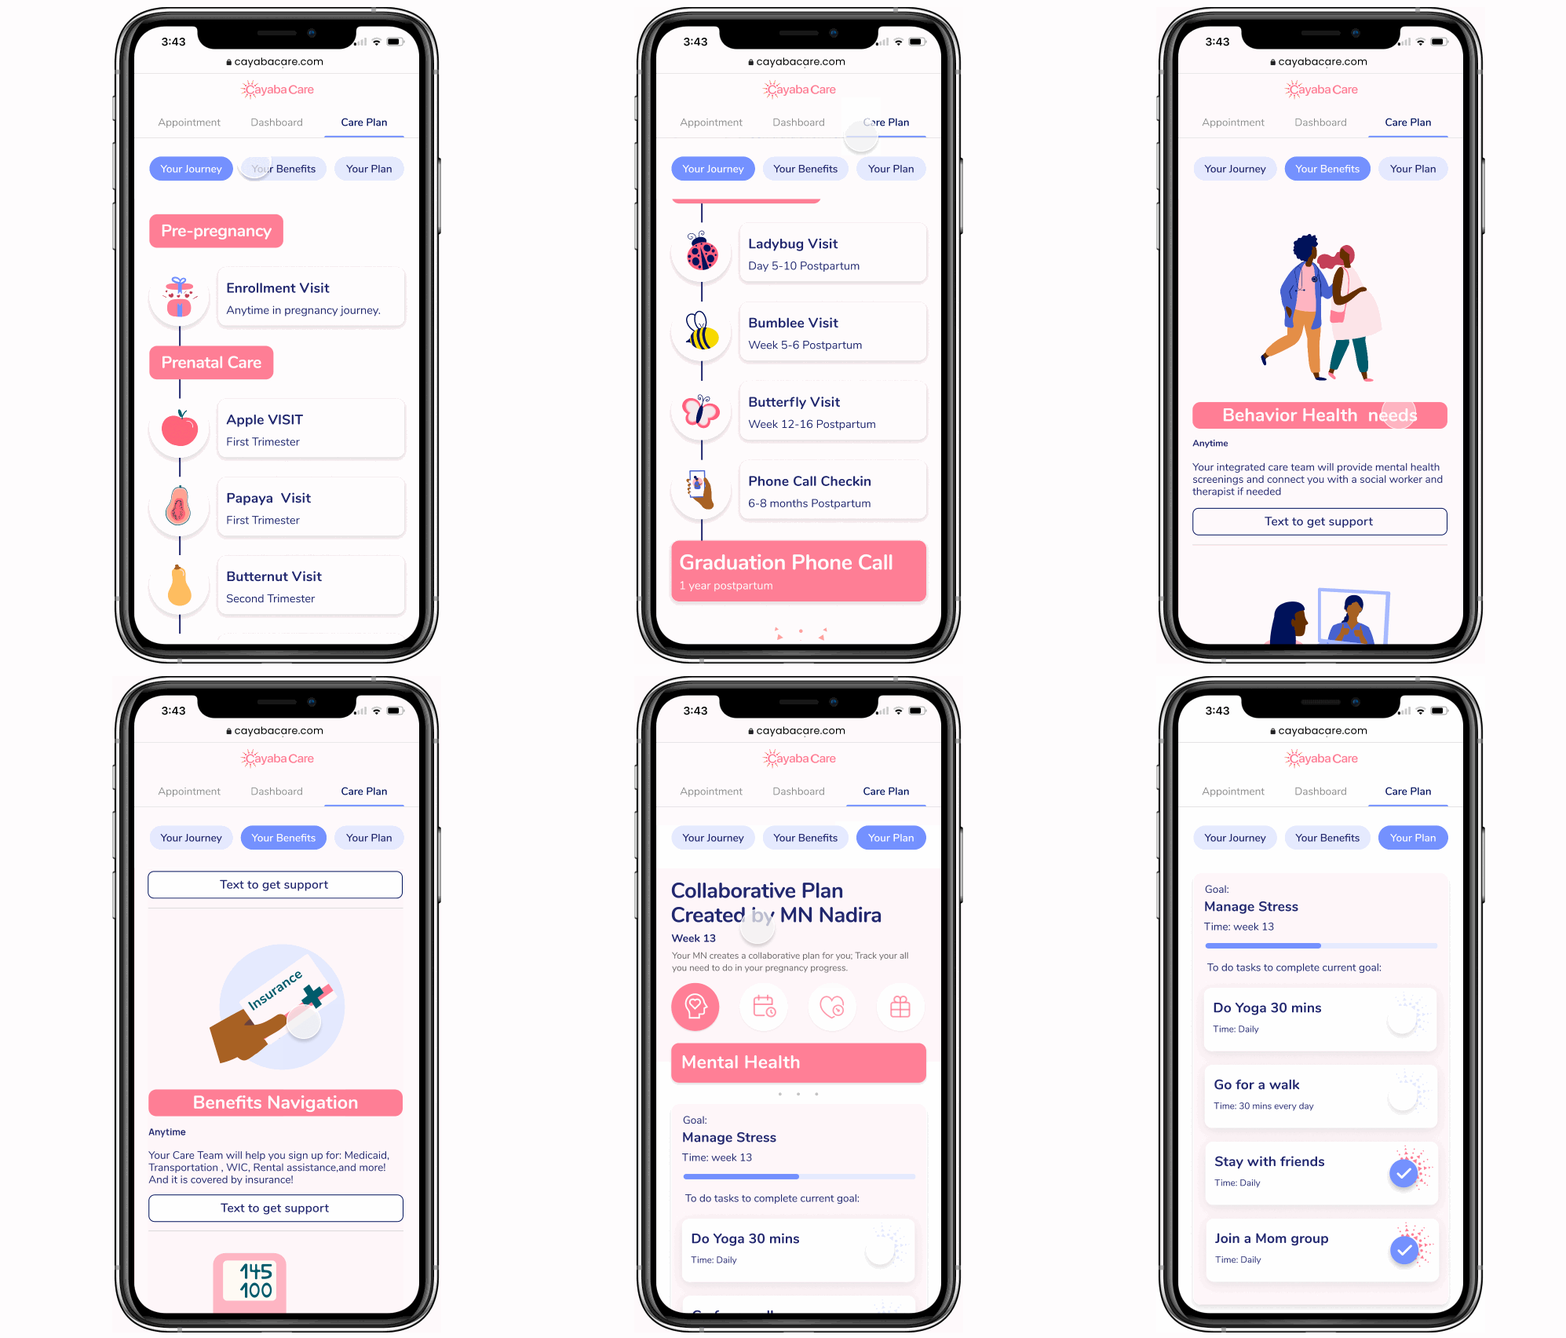
Check all services and benefits in one place
-
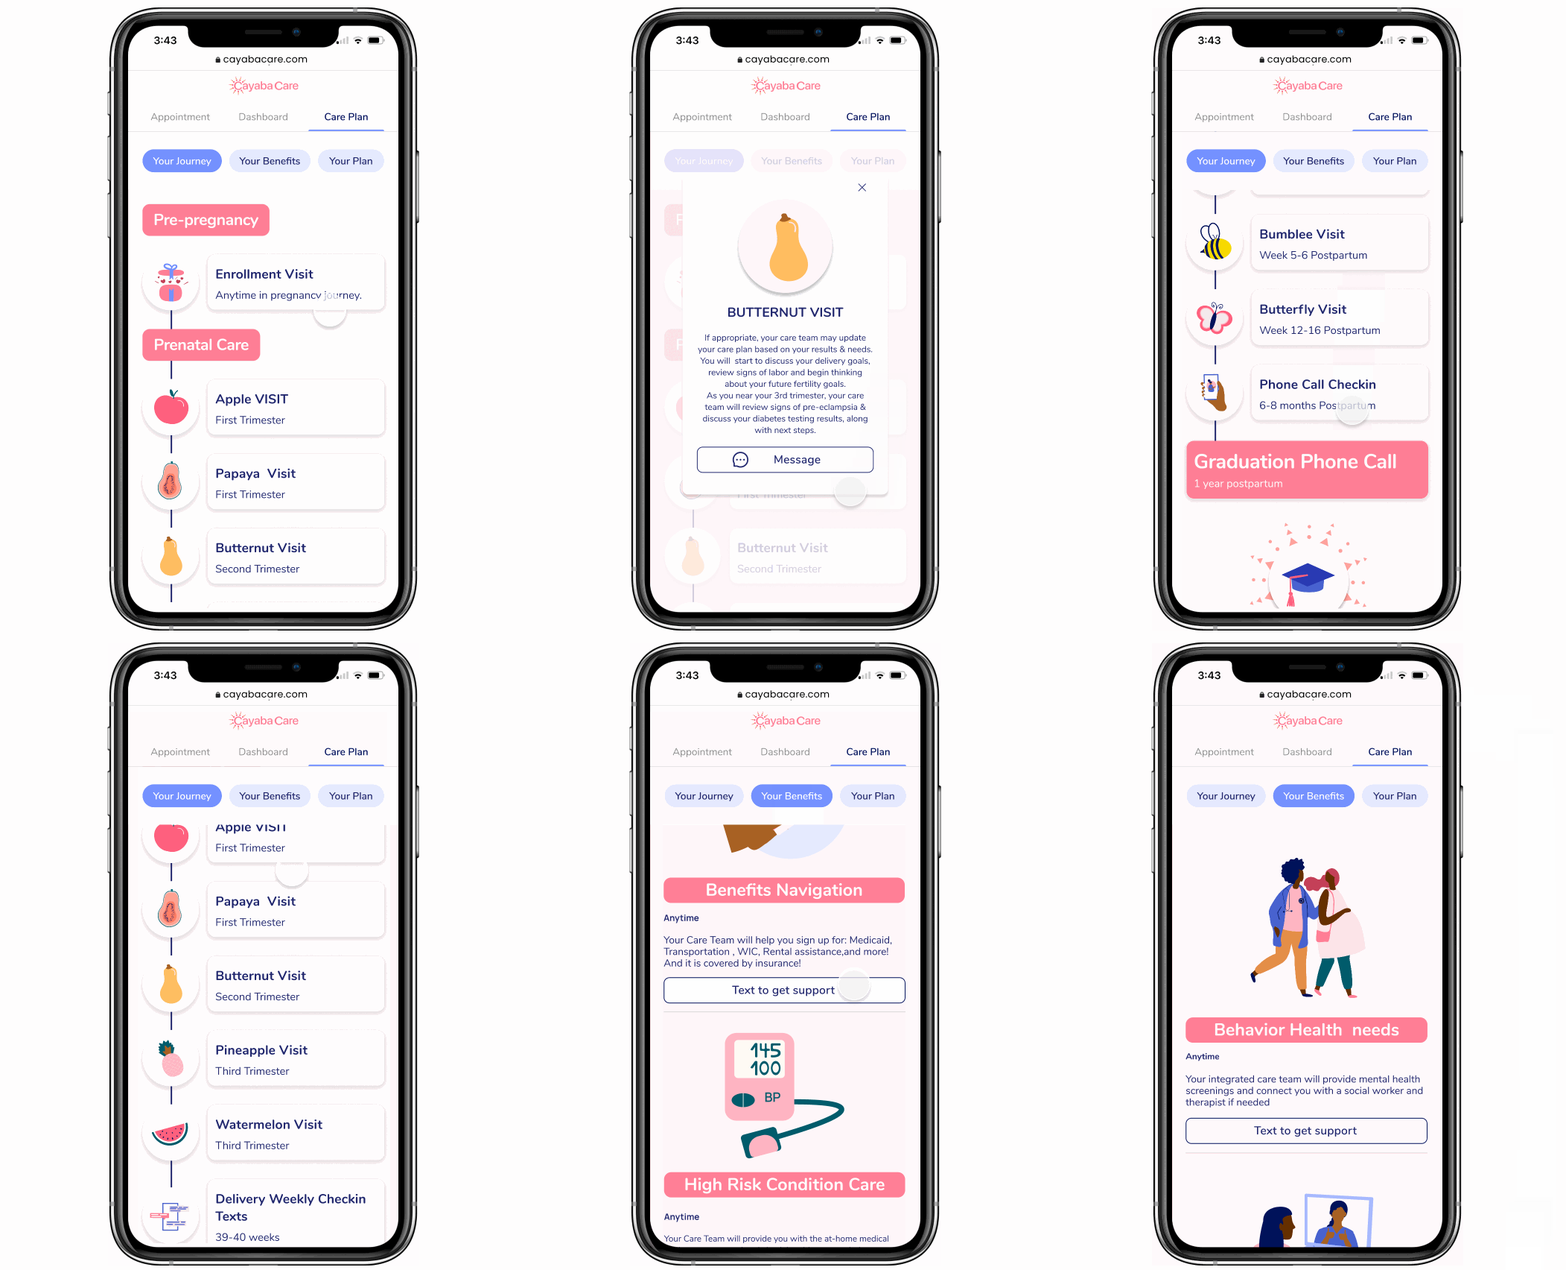
Your journey: introduce default care plan services in the pregnancy timeline
-
Your Benefits: Provide extra services in case that users need extra support
-
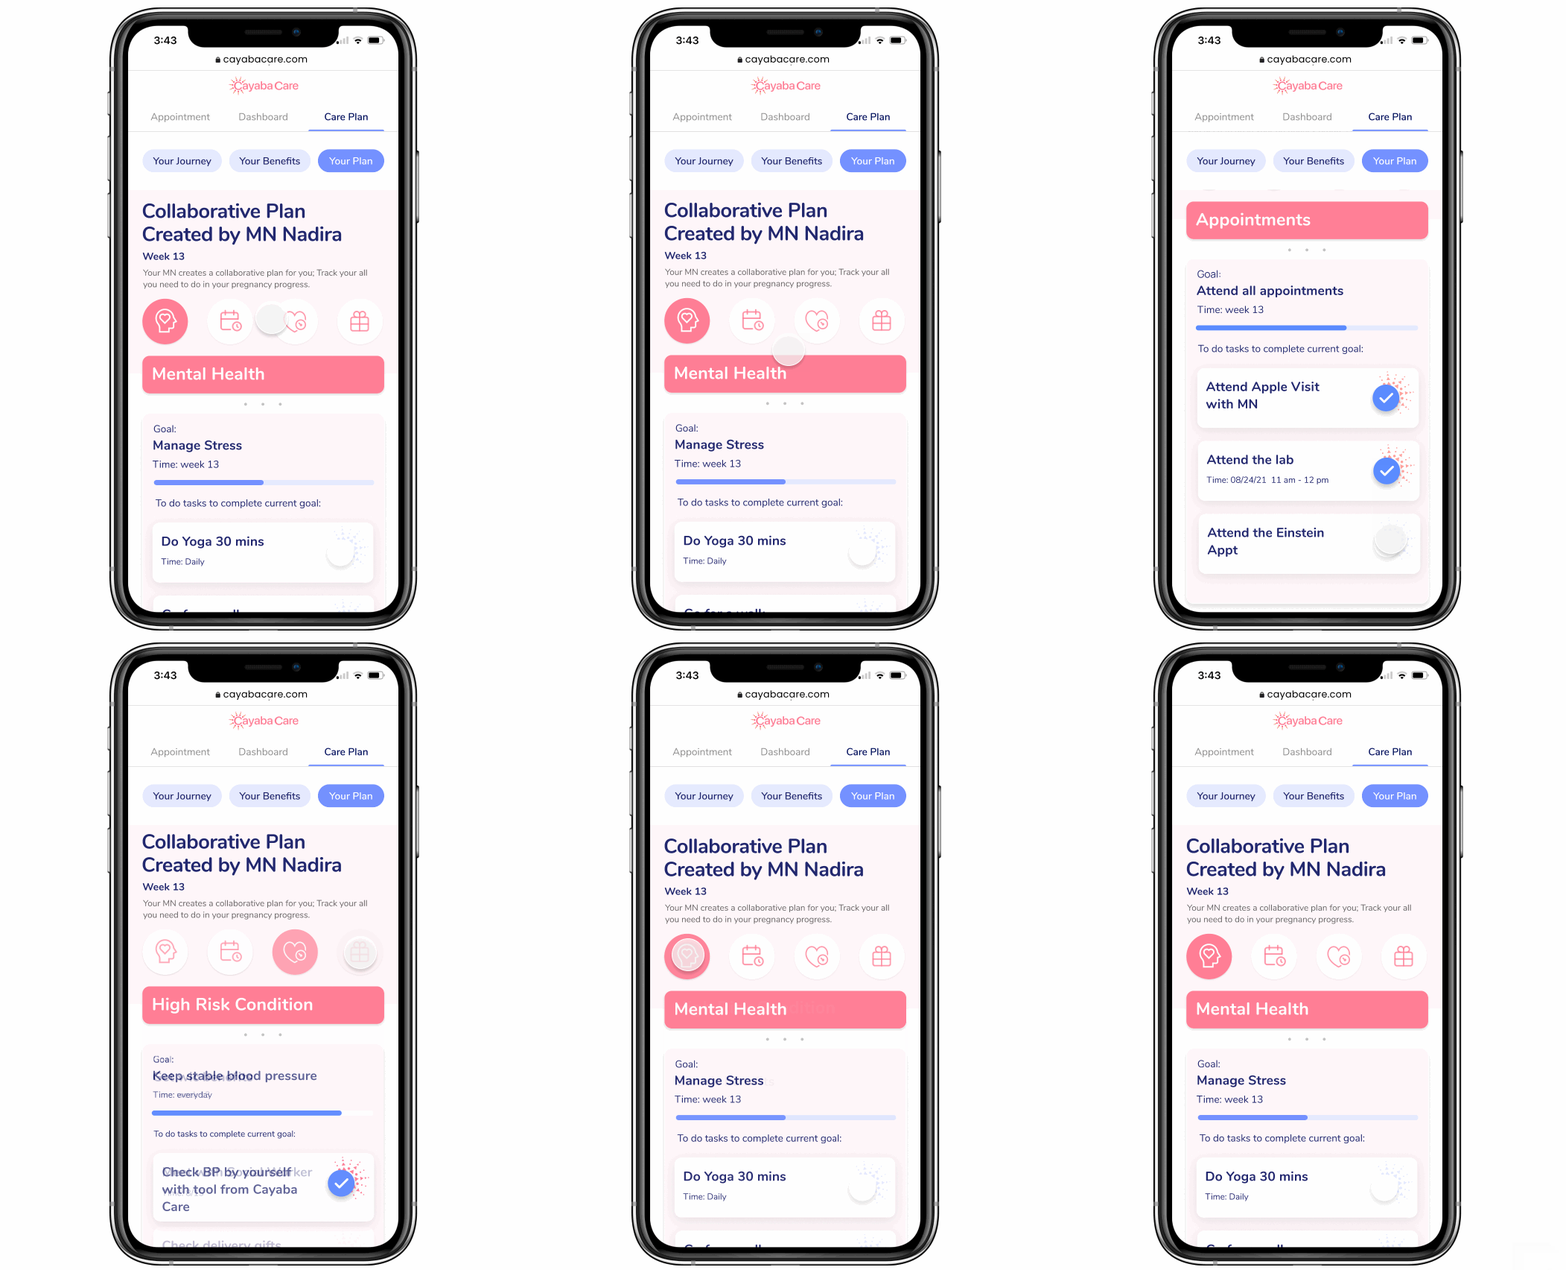
Your Plan: Personalized care plans customized by users according to their needs.


Problem 2:
-
Patients have no place to track all services through the pregnancy journey and information of each care plan visit and instruction is missing.
Solution:
Care Plan Journey and Extra Benefits
-
Divide care plan to journey/ benefits / personal plan for users to clearly know what is all service about.
-
A creative and vivid storytelling solution that helps users incorporate with holistic care plan journey and participate in the visit
-
Visualize Benefits Section to understand extra care plan services.

Problem 3:
-
Every mom is unique and they have different services and benefits need. There is no place for patients to see their personalized services and benefits. They could not track the process of visits and benefits they applied.
Solution:
Collaborative Personalized plan
-
Consider special conditions for each mom and provide a personalized plan for users
-
Customized recommendations care plans for moms to set their own goals and tasks according to individual unique conditions in their pregnancy journey.
-
Users can choose to click the tasks to track the process of each goal future to track their condition in the pregnancy journey

Illustrations Gallery

Success Metric
-
In order to drive retention and engagement, we need to launch our app to the majority of our engaged users. One of our success metrics is:
-
Have 60-80% of 400 engaged members adopt the app (login at least once) by the end of Q1
-
-
I conducted the usability testing and show prototypes to patients, and 90% of patients provide feedback that compared to the calling and texting, they would love to use the Cayaba Care patient app to check all care plan journey information.
Next Steps
-
Survey for feedback from users: How do users feel about this app?
-
Metrics Data tracking: if it reduces the phone calls, reduces the complaint, reduces the operation cost? How often do Patients check the app? How long do patients stay on the app?

Take Away
-
By doing 0-1 MVP product design, research, and rigorous testing each step as I went, I have made significant creations to the design and performance of the product. The design was well received and appreciated by both product team members and care team members. been shipped into production.
-
During the process, I have had different opinions on several design decisions with other teammates. The greatest thing that I have learned from negotiating and discussing with my teammates is to passionately embrace different opinions and ideas from others because the best outcome usually comes after the collision of different minds, that’s where it sparks.
